Map is a very important tool for a geographer. A clear idea can be formed about a region from it. We can show the whole world or a part of it through a map. We can provide information about a particular region by drawing a map and using some signs. A map is necessary not only for the geographer but also for all people especially travelers, administrators, planners, architects, engineers, agriculturists, meteorologists and even the common people. In this article classification of map, its importance, uses, local time and standard time etc. will be discussed.
At the end of this article, we will be able to :
• Explain the concept, importance and use, of a map.
• Describe the maps of various kinds.
• Explain how to present information on a map for practical use.
• Explain local time and standard time.
• Explain why time changes from place to place?
• Use of GPS
and GIS in the map.
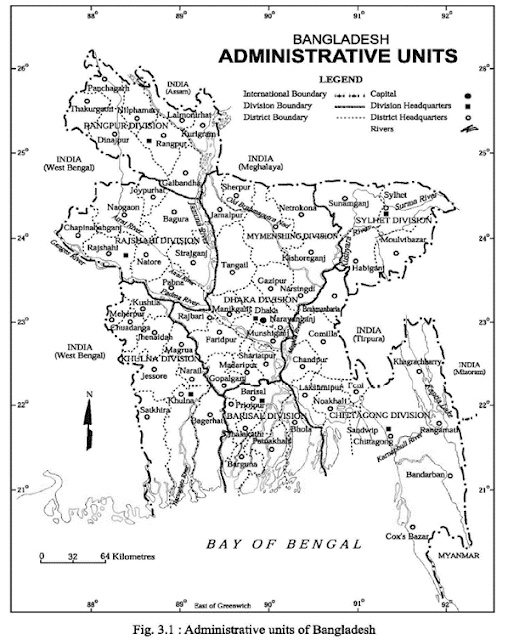
Look at the following map. It is the administrative map of
Bangladesh. On the paper the international boundary of Bangladesh, countries
around the borders of Bangladesh are located and the sea is drawn. Besides
these, it also shows the seven divisions, the districts in each division, their
names and areas. The whole administrative area has been shown in one page (fig.
3.1). In this way, the whole world, different continents, countries or
different divisions and districts can be shown on a map in one page.
You might have seen a wall map in your school. In your Geography
and Environment books or in any atlas you might have seen maps. Map gives us
ideas about a region, the nature of land, climate, plants, earth, water and
many other things. We can learn a lot about different continents and oceans
through it. The map may be defined as a representation of the earth's pattern
as a whole or a part of it on a plane surface with conventional signs, drawn to
a scale and projection so that each and every point on it correspond to the
actual part.
The word map comes from the Latin words 'mappa'. In earlier
times maps were drawn on clothes. The size of the map varies according to
scale. There are three ways with which the scale of the map is shown.
Methods of showing scale
(a) By statement
(b) By graphical scale
(c) By representative fraction or R.F.
(a) By statement : We
express the scale by statement such as four miles to one inch, one mile to 16
inches, etc. in every respect the first 1 (inch) is the map distance and second
number (mile, yard, kilometre) is the distance on the ground.
(b) By graphical scale : The
scale of map can be expressed by dividing a particular line into a number of
equal parts and is marked to show what these divisions represent on the actual
ground. By drawing a line of 5 centimetres and dividing it into 5 equal parts, each
part is 10 kilometres (fig. 3.2). Leaving one centimetres on the left side and
further dividing into equal parts of smaller sections each representing 2
kilometres.
(c) By representative fraction or R.F: Representative
fraction expresses the proportion of the scale by a fraction in which the
numerator is one and the denominators also in the same unit. Representation
fraction is commonly written as R.F. and is shown in the map as 1: 100,000.
This means one unit on the map represents 100,000 on the ground. If the 1 unit
is in inch then 100,000 is also in inch, if it is in centimetres then
both the units should be same. The formula of calculating R.F. is given below:
R.F = (Map distance)/(Ground distance)
Information that will be given in a map depends on (a) scale,
(b) projection, (c) conventional signs, (d) skill of the cartographer and the,
(e) type of map.
In the modern world, use of maps is very important. Map is known
as the tools of geography but it is also very important for the students,
historians, engineers, businessmen, journalist, soldiers, pilots, captains of
the ships and many more.
Classification of Maps
There may be various types of maps. Generally, on the basis of
scale used in scale, again the maps and subject matter, the maps are classified
into two groups. According to the maps are of two types: (a) large scale maps
and (b) small scale maps.
Navigation charts, aeronautical charts, mouza maps or cadastral
maps are large scale maps. As a small area is enlarged, so many date or
information can be accommodated in the map. Atlases, wall maps are small scale
maps. The whole world or the continent or any big region like that of a country
when shown on a sheet of paper, small space remains in the map. So, shown on
this type of map.
There are many types of maps:
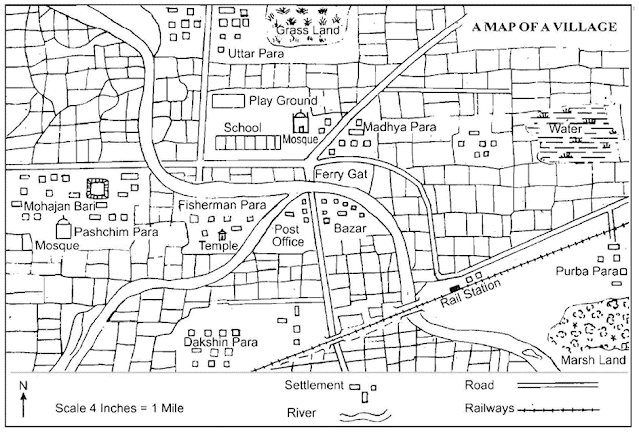
1. Cadastral or Mouza map: The term cadastral is
derived from French word 'cadestre' meaning register of territorial property.
The cadastral maps are drawn to register the ownership of landed property by demarcating
the boundaries of fields and buildings. The village maps of our country and the
city plan maps belong to this category (fig. 3.3). These maps are very large scale
maps which are drawn on a scale of 16 inch to 1 mile or 32 inch to 1 mile.
2. Topographic map : Topographic
maps are made on a large scale on the basis of precise survey of the area. They
show general surface features in detail which contain both natural landscape
and man-made features. The scale of the topographic map varies from 1 inch to 1
mile to ¼ inch to 1 mile. Topographic map shows relief, rivers, forests,
villages, towns, roads and railways (fig. 3.4). The topographic maps are
prepared in different scales in different countries. The standard and most popular
topographic survey map of British Ordinance Survey is 1 inch
to 1 mile. Topographic maps of Bangladesh have been made into three
scales. i.e. (i.) 1 inch= 1 mile, (ii.) 1 :50,000 and (iii.) 1 :250,000.
The last two types of scales have been adopted for the latest topographic maps
of Bangladesh.
3. Wall map : Wall maps are generally drawn for
using in the classroom. The world as a whole or in hemispheres are shown on the
wall maps. Wall maps may also be prepared for a country or continent, large or
small according to need (fig. 3.5). Their scale is smaller than topographic
maps but larger than atlas map.
4. Chorographical or Atlas map : A collection
of map is called an Atlas. The scale of the atlas map varies from 1: 100,000 to
1: 1000,000. These are small scale map which gives a more or less highly
generalized information regarding the physical and economic conditions of
different regions of the world
5. Physical map : Map which shows the
natural features as mountains, plains, rivers, deserts, wetlands of a country
or a region is known as physical maps. These natural features are shown with
different colours. Plants are shown by green colour, mountains and hills by
brown colour, rivers and water bodies by blue colour and highland or plateau by
yellow or orange colour.
6. Geological map : The rocks that form the
crust of the earth, their mode of formation and deposition are shown on
geological map.
7. Climatic map : The climatic map shows the
average condition of temperature, pressure, wind and precipitation of a region
over a long period of time.
8. Vegetation map : Vegetation map shows the
natural vegetation of a region.
9. Soil map : The soil map shows the various types of
soil covering the area. Agriculturists use this map usually as it highlights the
quality of soil of a particular area.
10. Cultural map : Economic condition,
political boundary, historical places are shown on cultural maps. Cultural map
can be divided into some parts. These are :
a. Political map : Most widely used map
showing the boundary of a region, country, division, districts etc.
b. Distribution map : Map showing the
distribution of population, crops, animals, industries of a region or a country
is known as the distribution map.
c. Historical map :Map showing places of
historical importance is the historical map.
d. Social map : Map showing the
distribution of religion, language, nationality is known as social map.
e. Land use map : Major land uses of an area
or region are shown in land use maps. These maps show various kinds of land
uses in urban and rural areas such as roads, buildings, industries and parks
are shown in urban land use maps and cropland, homestead, fallow land, forest
etc. are shown on a rural land use map.
Techniques of Presenting Information in a Map
A Map is a geographer's tool which is used by various types of
people from different occupations. The natural and cultural features that are
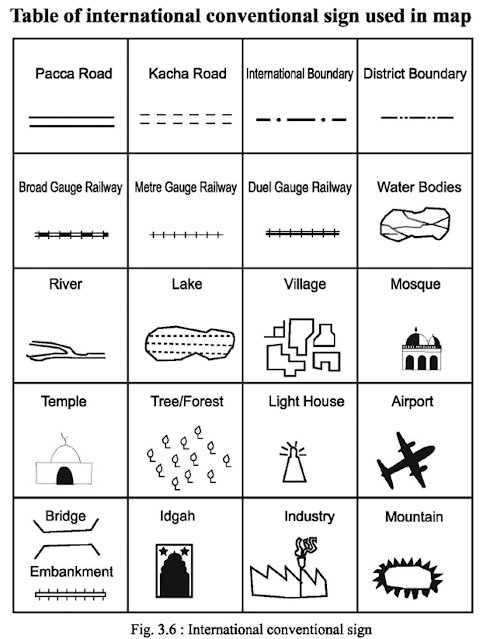
shown in a map should be universal, so that people belonging to any country can
read the map by knowing the international conventional signs used in the map.
The international conventional signs are given so that students have a general
understanding of those signs (fig. 3.6).
Marginal information of a map : All the information
required to understand a map should be around its margins. Marginal information
includes (i) Title/heading, (ii) Scale, (iii) North line, (iv) Legend and (v)
Source of data.
(i) Title/heading : Each map has a title or heading. It
shows the type of map. If it is a political map of Bangladesh, the title will
be 'political map' followed by Bangladesh.
(ii) Scale : There are three common ways to show the
scale by statement, representative fraction/RF or linear or graphical scale.
(iii) North line : North line is important for a map. It
is usually considered the top section of the map as northern part of the map.
North line can be shown anywhere in the map within the margin of the map. The
position of the north line depends on the layout and size of the map within the
margin.
(iv) Legend : In each map some data is presented in
the form of some conventional signs, colour or shades. The representing signs,
colours and shades are shown in the legend.
(v) Source of data : All maps are drawn on the
basis of information or data so the source of data should be provided outside
the margin i.e. border of the map layout.
Local Time and Standard Time
As the earth rotates, every place has its sunrise, sunset and
noon. When the Sun is at its highest point in the sky, it is noon and also
known as zenith. The earth rotates from west to east. So, places in the east
see the Sun first. Places in the west see it later. So, for each 1 ° of
longitude towards the east, a time of 4 minutes has to be added. For each 1 °
of longitude towards the west a time of 4 minutes to be subtracted from the
Greenwich Mean Time or GMT, which is the 0° meridian or prime meridian located
at Greenwich in London.
Local time
Everyday the earth moves round her axis from west to east. As a
result, the sun appears earlier in the places located in the east. Due to
rotation of the earth, the sun reaches the zenith of the sky, or in other words,
the sun reaches its highest altitude on a certain place and that hour is
treated as 12:00 noon. On the basis of this noon time, the other time for the
day is determined. The time thus determined is the local time for that place.
So, the local time of a place is determined on the basis of the highest altitude
of the sun which can be observed with the help of a sextant.
The earth at the centre creates 360°. The earth requires 1,440
minutes (24 hours x 60 minutes) to cover this distance of 360° for one time. So, the
earth needs 4 minutes (1,440 + 360) to rotate 1 ° of
longitude. Therefore, for 1° difference of longitude, the difference of time
will be 4 minutes.
Standard Time
In any country there are many meridians of longitude that run
through the country. If there are ten meridians running through a country as
each meridian is 4 minutes apart so, 10 x 4 = 40 minutes, so in that country
there will be ten different local times according to the meridians. To avoid
this confusion, the local time of a central meridian of a country is taken as
the time for the whole country. This is called the Standard time. Some
countries have great longitudinal extent, so they have more than one standard
time. Example USA has five and Canada six time zones.
There is a general understanding among the countries of the world
to select the standard meridian of any country in multiples of 7.5° longitude.
Every 7.5° longitude makes a difference of 30 minutes.
Time Difference on the Basis of Location
In the earlier chapter we have seen for 1 ° longitude, the time
difference is 4 minutes. We know, earth rotates from West to East. For this
reason, in Bangladesh day comes earlier in the places which are located in the
East than those which are located in the West. From this we can understand that
morning comes earlier in those countries which are located in the East of
Bangladesh and those countries which are located in the West of Bangladesh,
morning comes later.
We know for the difference of 1 ° longitude,
time difference becomes 4 minutes. This 1 ° is divided into 60 minutes and for
every 1 minute, time difference becomes 4 seconds. So, for 60 minutes it
requires 60 x 4 = 240 seconds or 4 minutes.
GPS and GIS Maps
At present the use of GPS and GIS are the most modem form of
information for study and management. The English of GPS is Global Positioning
System. If we want to know the global location of a certain place, the
easiest way of knowing it is through GPS. Through GPS the latitude, longitude,
height and distance of a certain place can be found. Besides, the north line,
date and time of that place can be known.
Working Principle ofGPS
GPS collects information from the land-satellite through its receiver.
To collect this information GPS needs cloud free sky. The GPS machine can work
accurately in the clear sky. Sometimes it faces problems to identify
the location of steep high hills, buildings and it is time consuming also.
Benefits of GPS : Among
many discoveries of technology GPS has earned a wide popularity as a very
valuable tool for the geographers. With the help of this tool we can find out
latitude, longitude and other matters within seconds. In our
country a great problem lies in land surveying. We will be able to identify
the boundary of our land without any problem. This will save much of our time.
During any natural disaster we will be able to send relief goods to
a certain place by identifying its exact location by latitude and longitude
with this GPS.
Demerits of GPS: GPS has some problems along
with its benefits. These are-its price is high, so it
is not easily available. Most of the people are not familiar with it. Besides these,
people tend to use traditional system.
Geographical Information System
Storing and analyzing geographical information system is known
as GIS. It is a computerized system of storing information and analysis. This
system helps to prepare future plan through storing geographical information,
analysis and management, identifying spatial problem. The use of GIS started
first in 1964 in Canada. Gradually people started using it widely around 1980. At
present it is being used in land management, natural resource development, water
research, urban and regional planning, population analysis, transport and communication
system analysis.
The utility of a map is increased by it through the presentation of many kinds of data and analyzing those data in the map. For example, we can have a full idea of a particular place by showing its water management, topography, land use, communication, soil, road etc. in a map.


Great post by the great author, it is very massive and informative about Earth With Clouds Globe Ornament Online USA but still preaches the way to sounds like that it has some beautiful thoughts described so I really appreciate this post .
ردحذفYou have provided a richly informative article about e-navigation maritime solutions. It is a beneficial article for me and also helpful for those who know about. Thanks for sharing this information here.
ردحذف